


👋 Hey there! In this blog, I will show you how to monitor memory utilization for your EC2 instance and set an alarm using AWS CloudWatch (E.g., if you want to set an alarm when your EC2 instance storage reaches above 90% or something), So let’s get started.
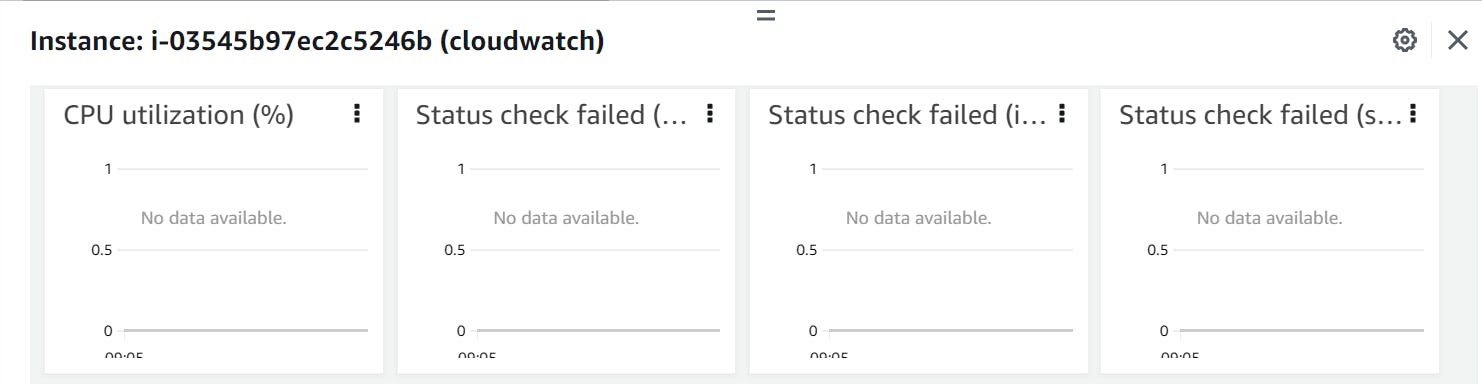
Whenever you launch an EC2 instance, Under the Monitoring tab AWS by default monitor different metrics such as CPU Utilization, but if you notice there is no option to check your memory usage. It is because AWS by default doesn’t monitor that, It is a part of your custom metrics.
To monitor your custom metrics and send alerts to CloudWatch, first you need to install the CloudWatch agent on your EC2 instance.
Step 1
First, you need to create an IAM role to send custom metric data to CloudWatch and then attach this role to your EC2 instance (I assume that you already have an EC2 instance launched). To do this go to IAM → Create Role → Select EC2 → Next, and add these two policies to it.
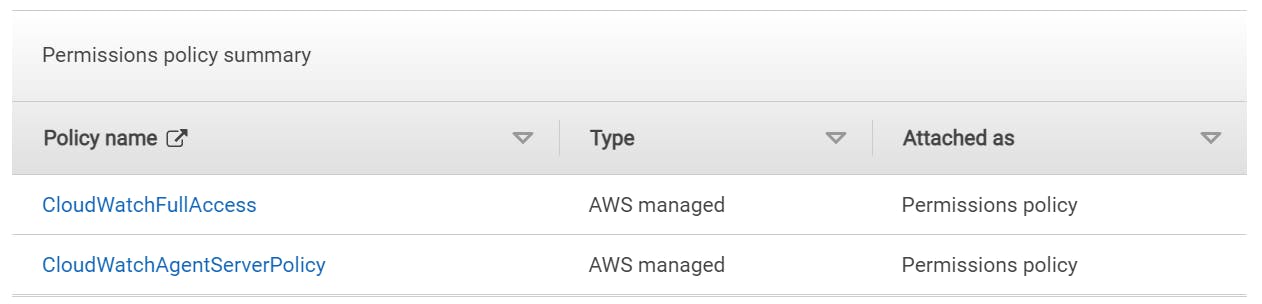
Once you add these policies click on Next and give your role a name something like CloudWatch-EC2 role.
Now after the role creation is completed, go to your EC2 instance → Select the EC2 instance you wish to monitor → Select Actions → Security → Modify IAM role.
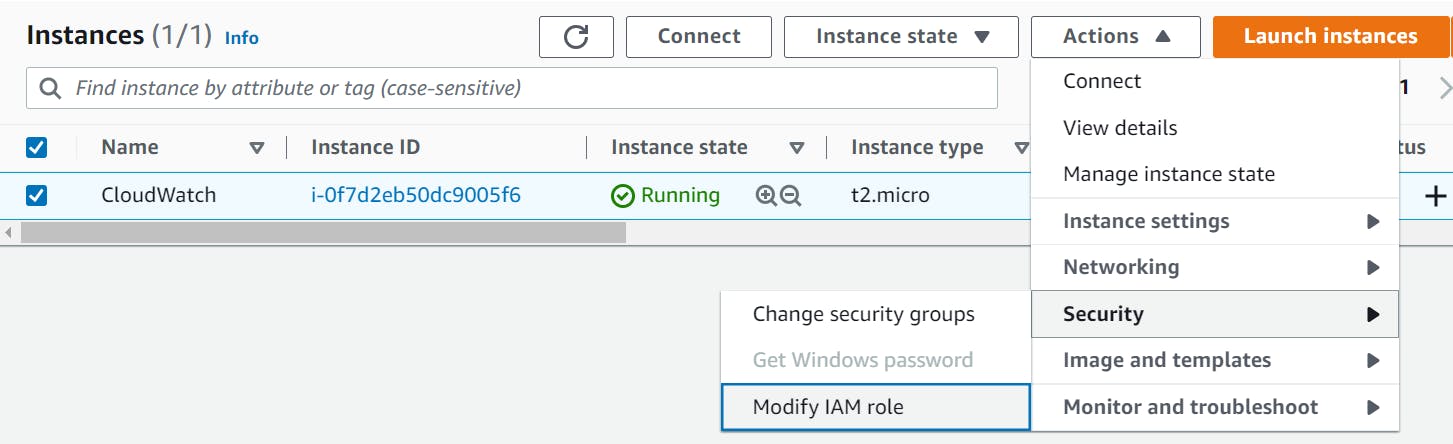
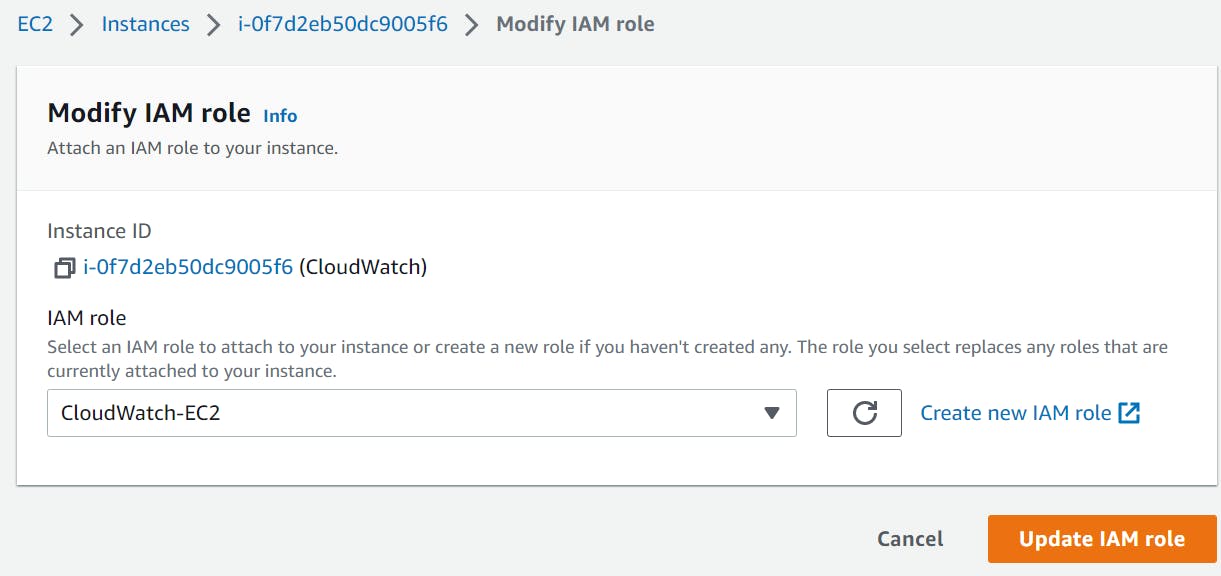
Here Select the IAM role we created earlier and Click on Update IAM role.
Till now we have created an IAM role and attached it to EC2 Instance, now we need to install CloudWatch Agent on the EC2 instance and collect the metrics.
Step 2
Login to your EC2 instance and Install Agent as shown below:
🖊️Note that here I am using 'Amazon Linux 2 AMI (HVM) - Kernel 5.10, SSD Volume Type' machine, So commands will change as per your OS
| sudo yum install amazon-cloudwatch-agent
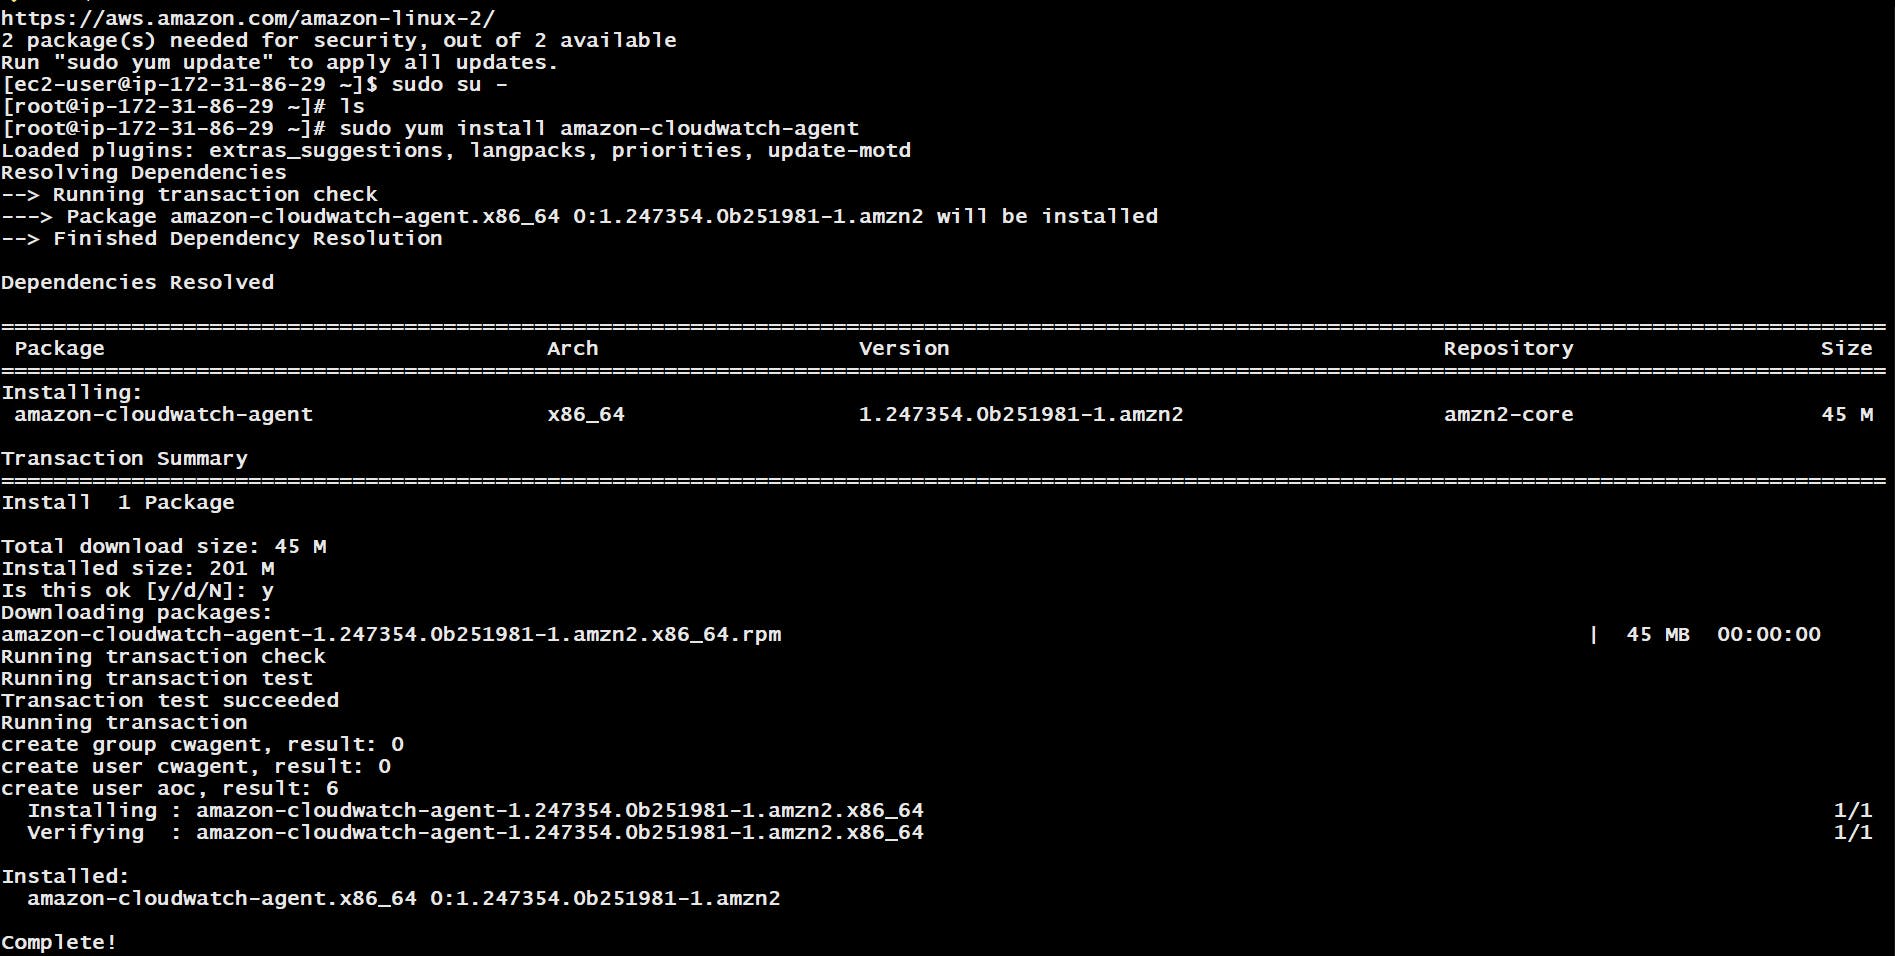
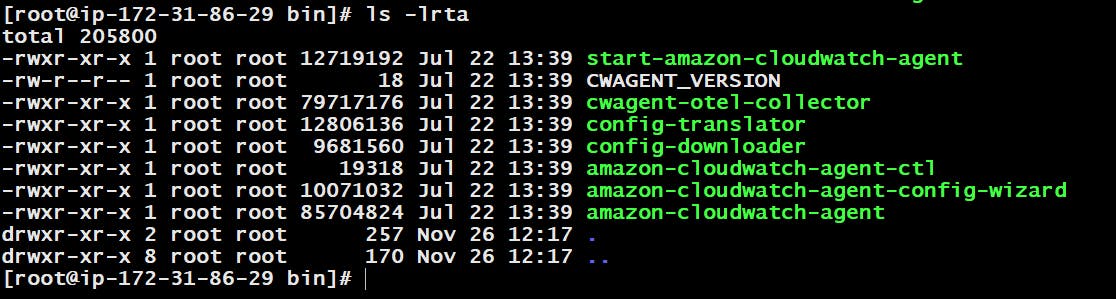
Amazon by default Installs CloudWatch agent in the below folder structure, Now go to this path and you will see different files over here
| cd /opt/aws/amazon-cloudwatch-agent/bin/
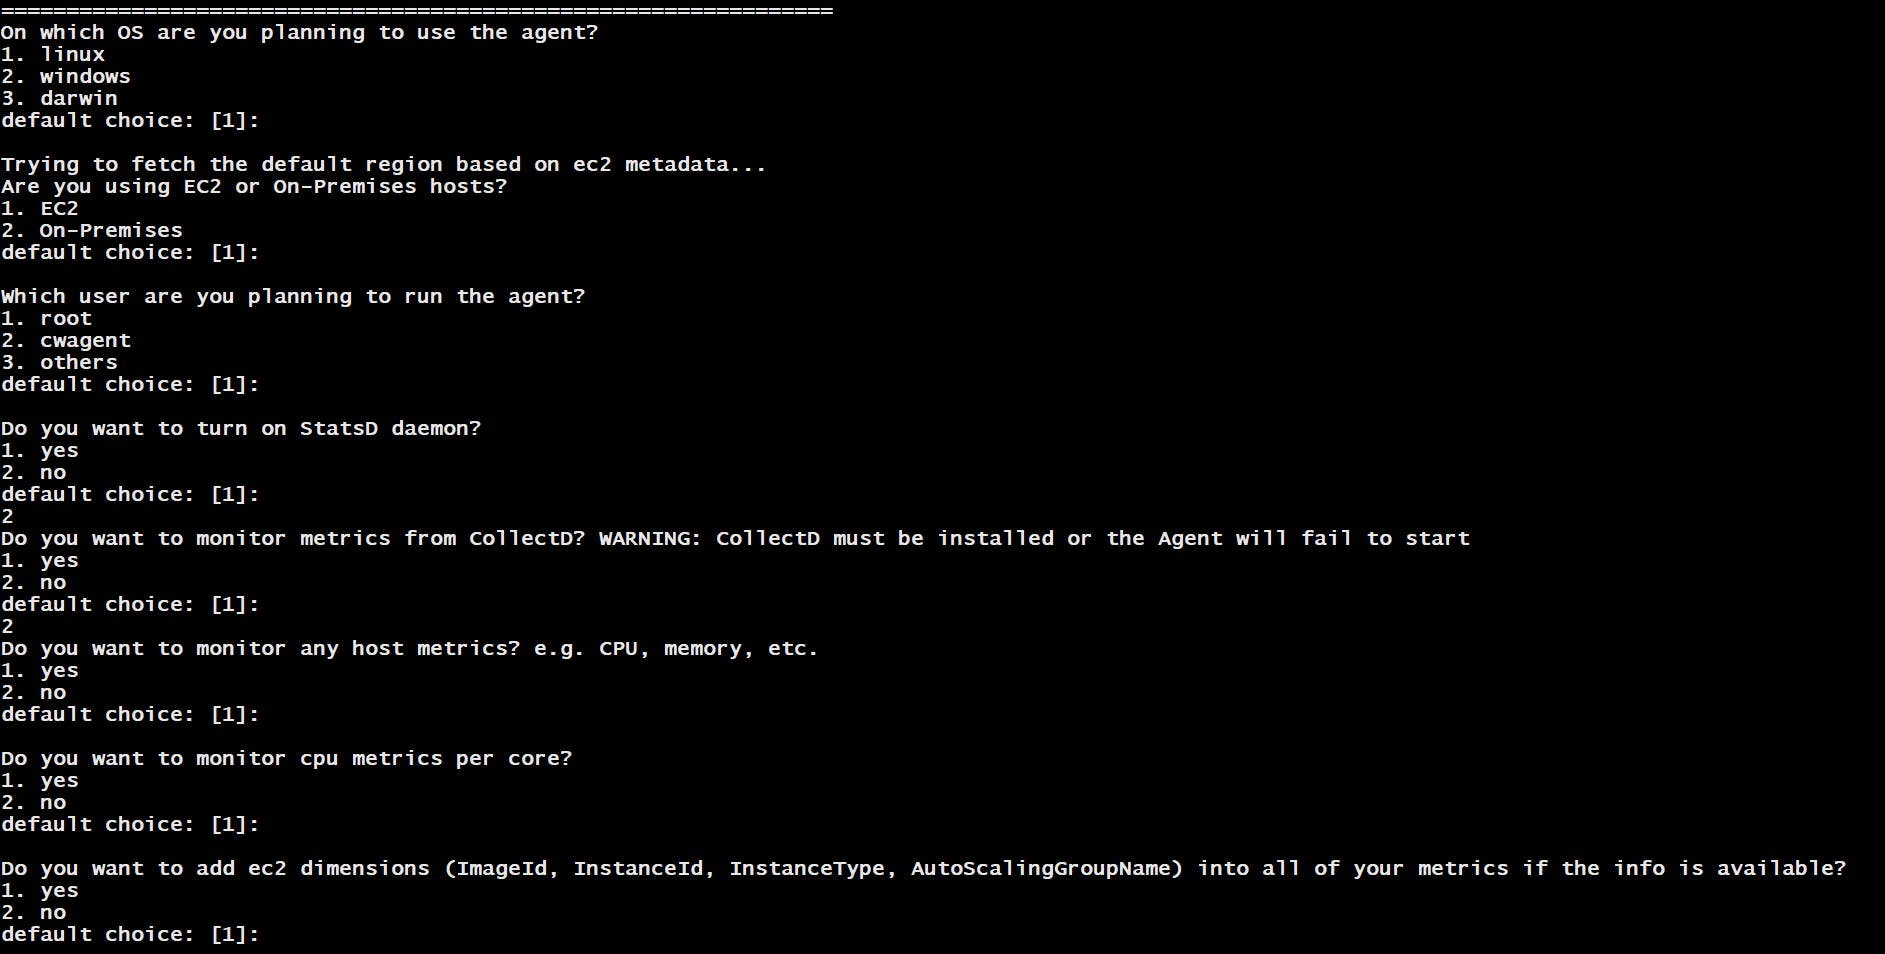
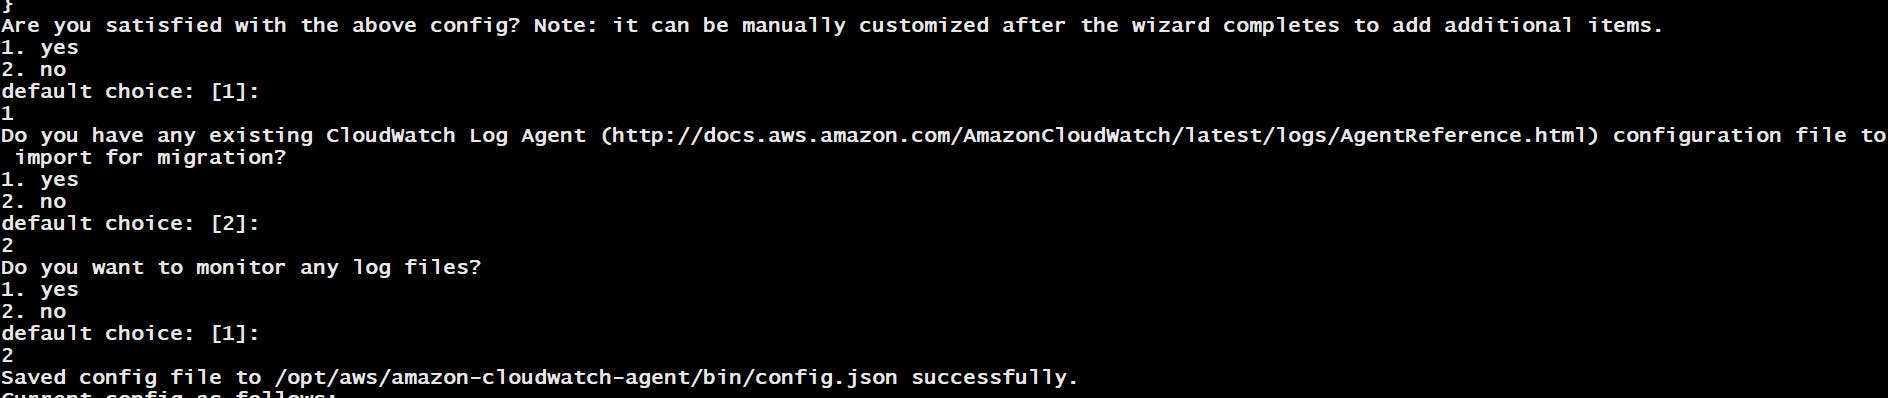
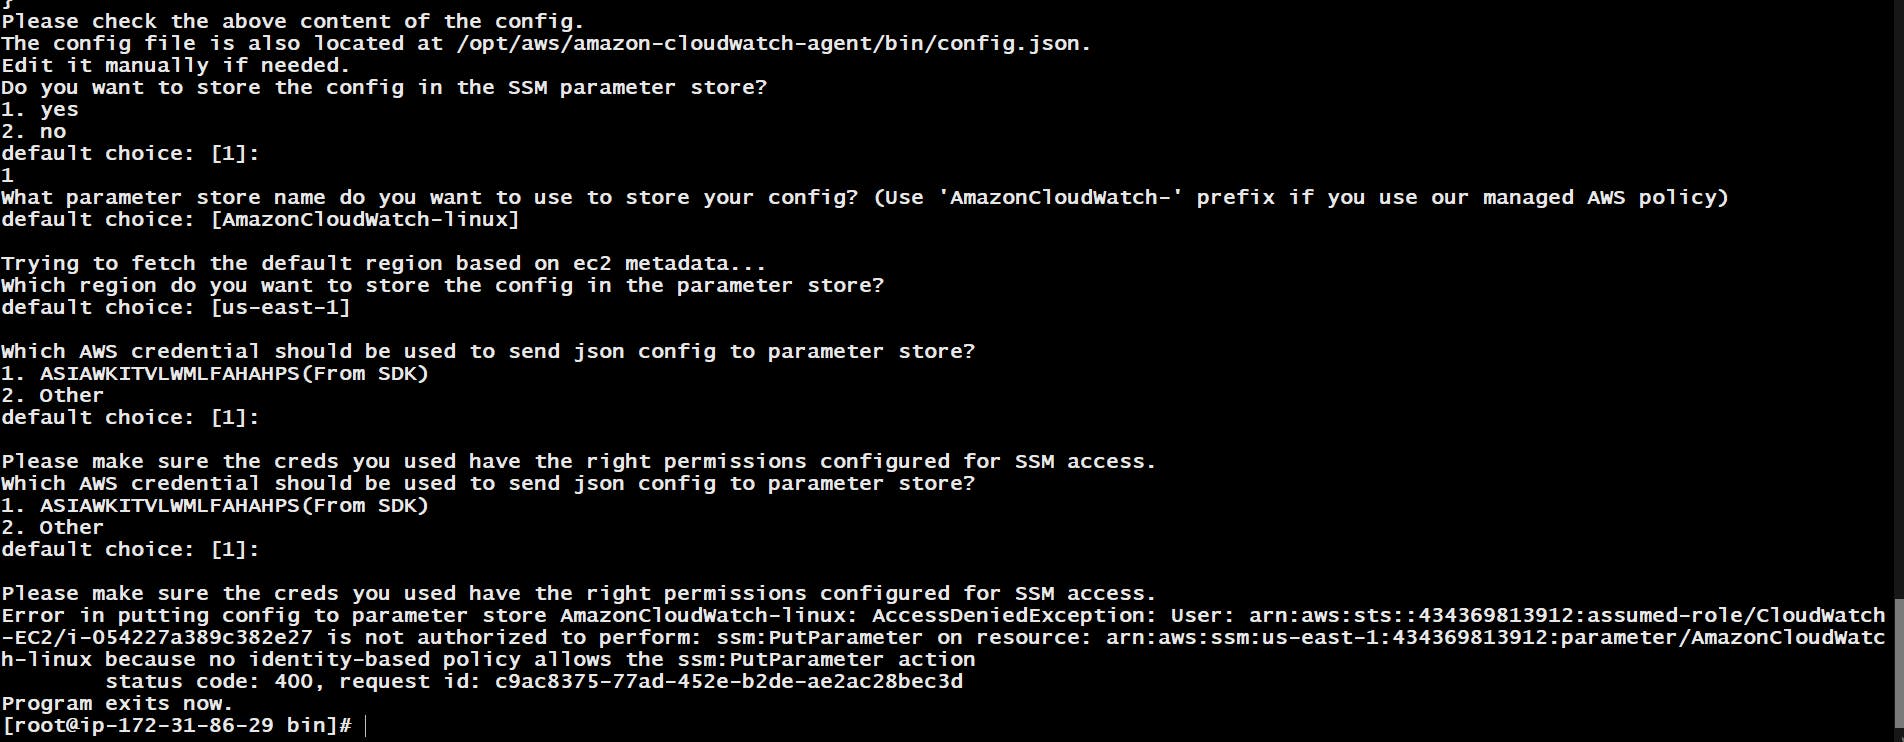
Now for configuration, we need to execute "amazon-cloudwatch-agent-config-wizard". Once you execute, It will ask for different questions regarding what metric you are going to monitor, etc. Please answer them accordingly as per your requirement.
| ./amazon-cloudwatch-agent-config-wizard
I am attaching the screenshots regarding all the options that might help you to understand the scenario, You can select accordingly.
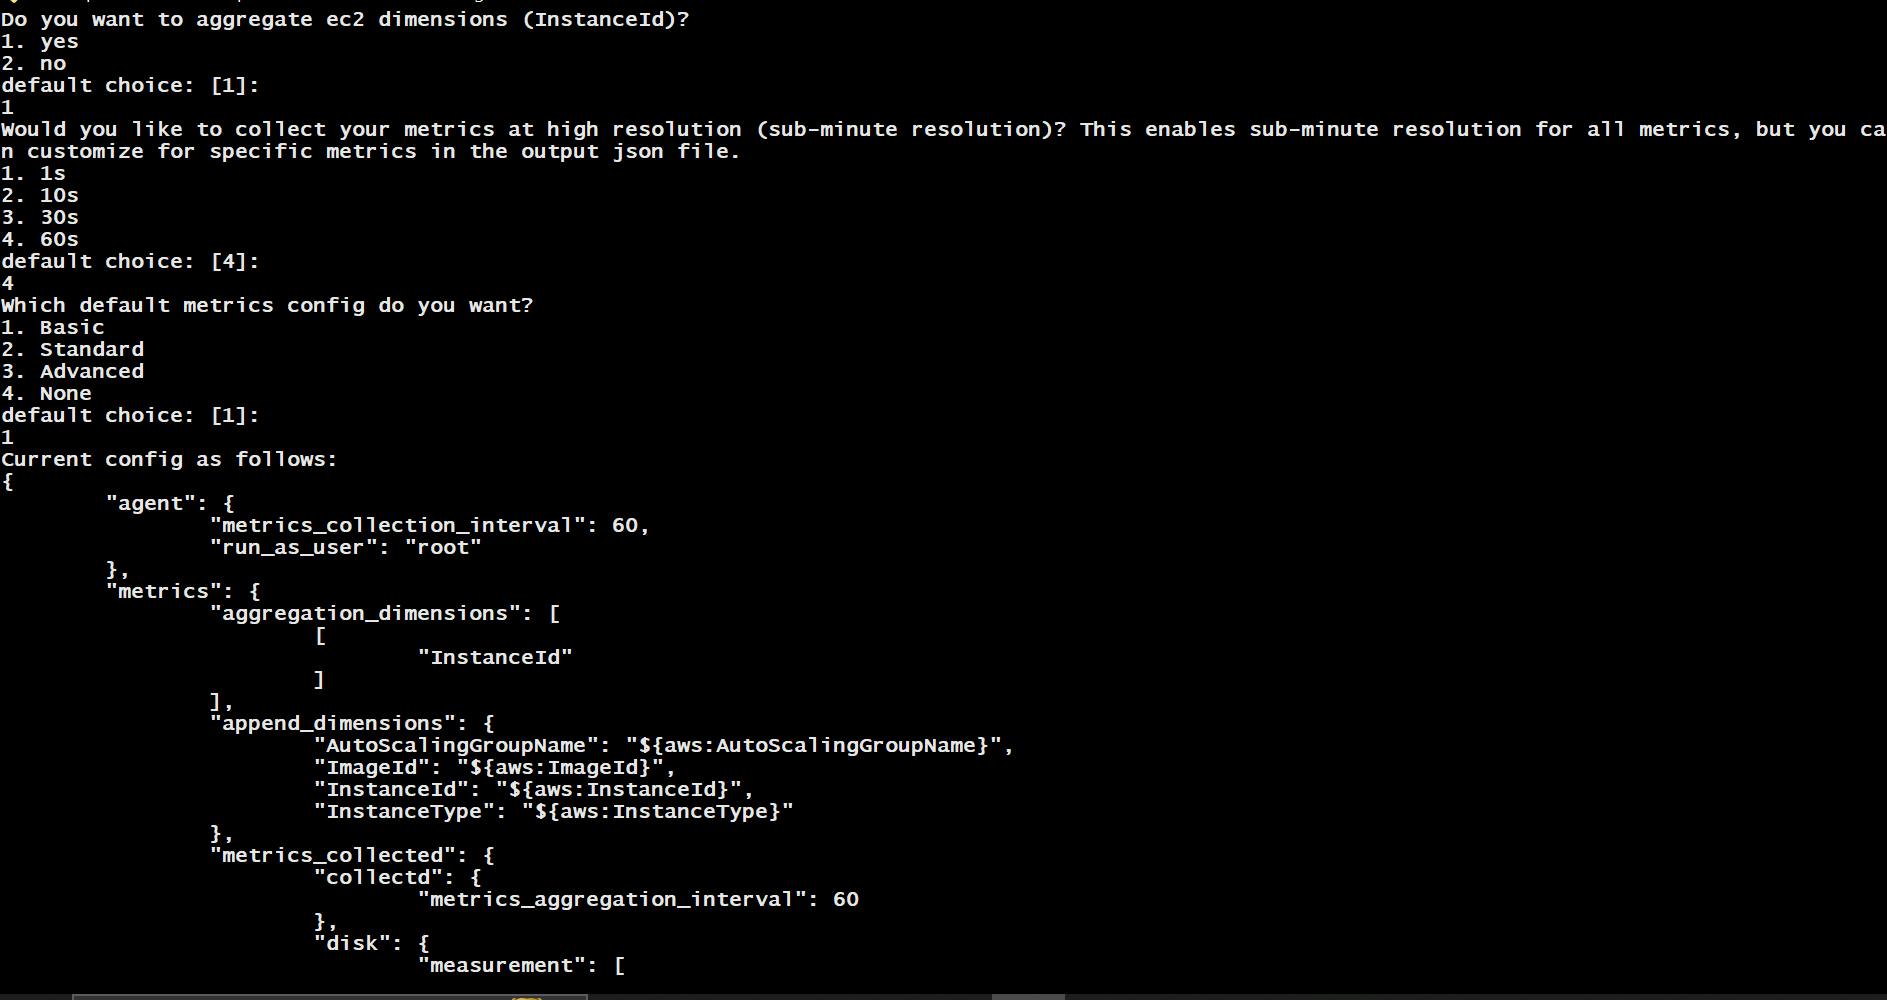
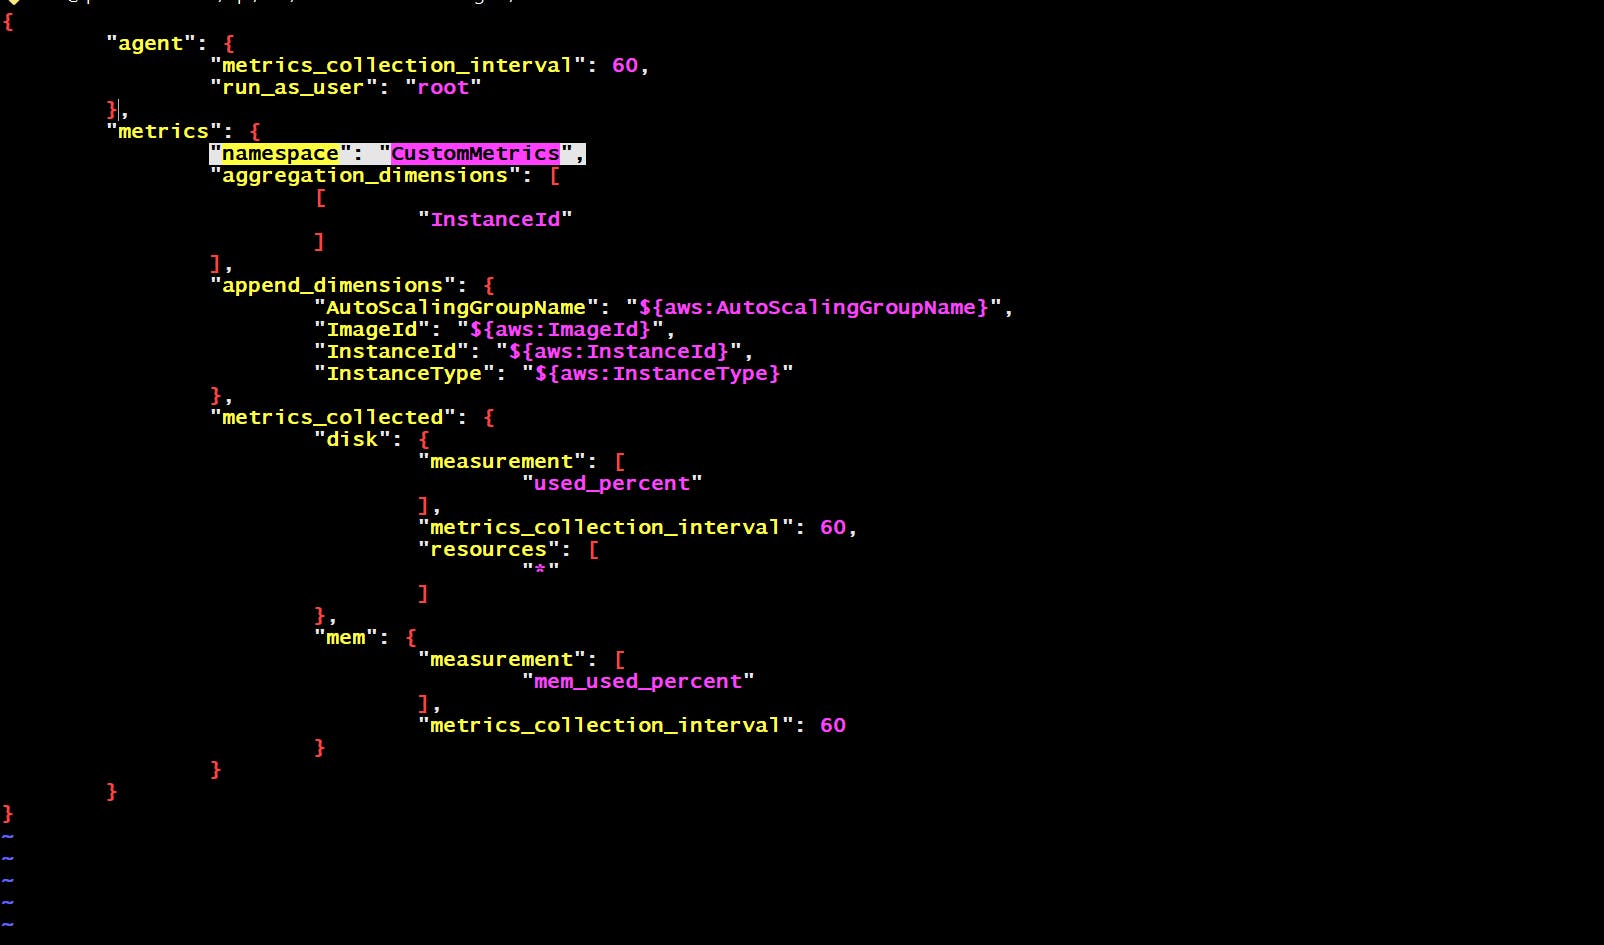
Once you complete the above configuration, You will see the 'Config.json' file is generated on the same path. Let's open that file and add the namespace just above the aggregation dimensions to identify the metric as shown below In my case, I have given "namespace":" CustomMetrics",
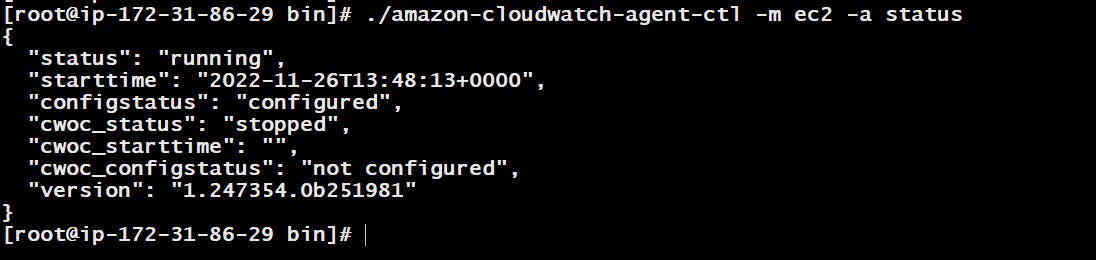
Now check the CloudWatch Agent status by using the below command It should be in a stopped state.
🖊️Note - Make sure It is stopped, If In case it is running then please stop and start again to reflect the changes in config.json
| ./amazon-cloudwatch-agent-ctl -m ec2 -a status
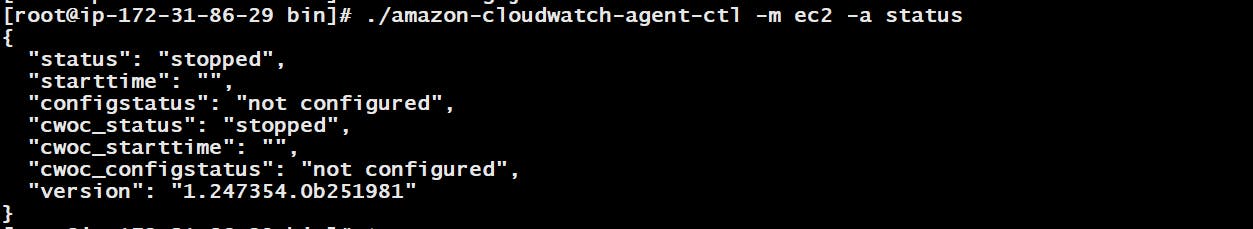
As long as your status looks like this you are good to go, If not don't worry you can stop the agent using the above command just replace status with stop and then start the agent again.
Now, run the below command to fetch the config which we have changed in the above config.json file
| ./amazon-cloudwatch-agent-ctl -a fetch-config -m ec2 -c file:config.json -s
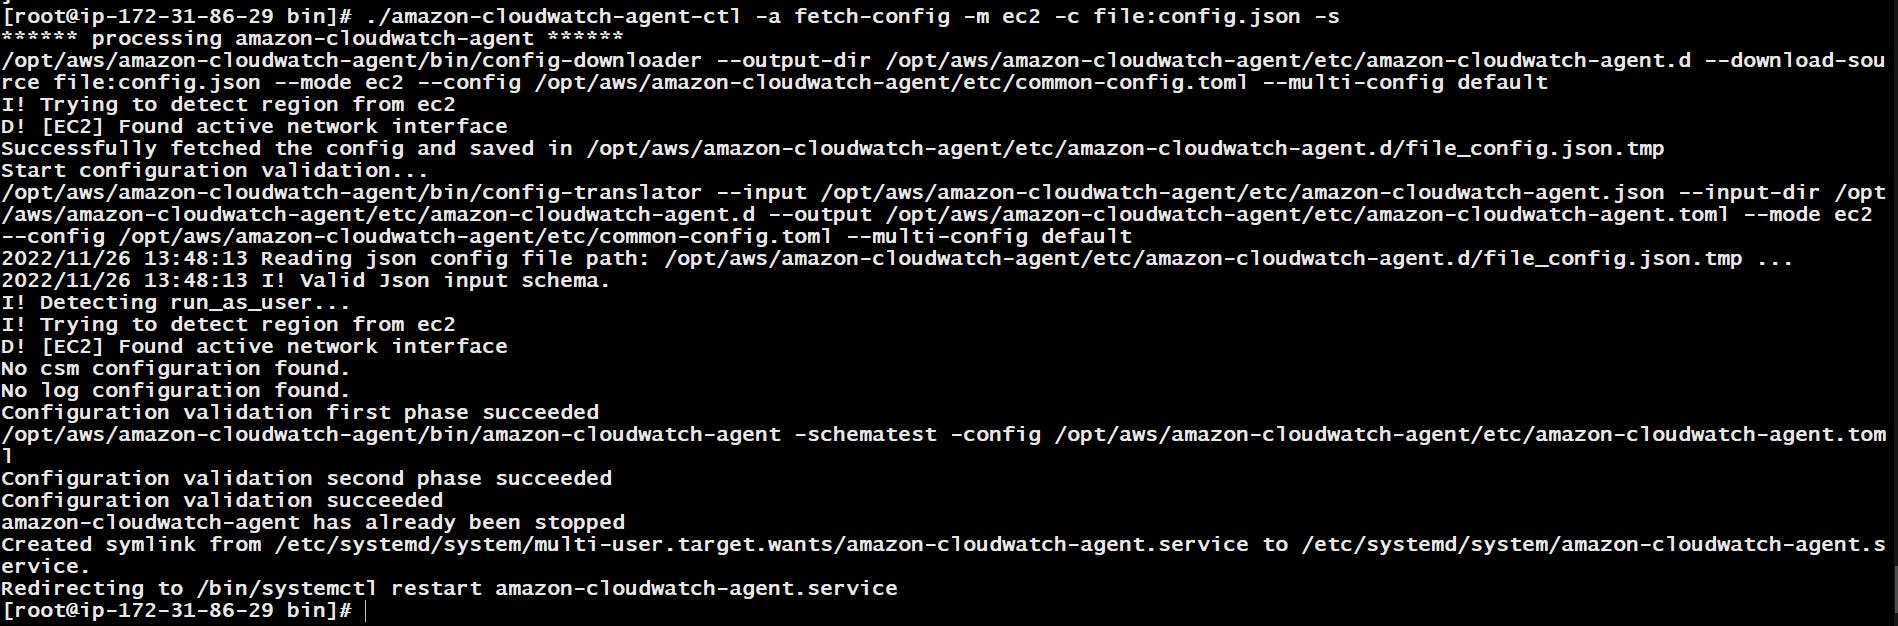
Now check the CloudWatch agent status again using the above status command and It should be running.
Step 3
Now, wait for some time and go to CloudWatch Dashboard on the AWS console → navigate the left panel → Go to Metrics → All metrics → Custom namespace → CustomMetrics
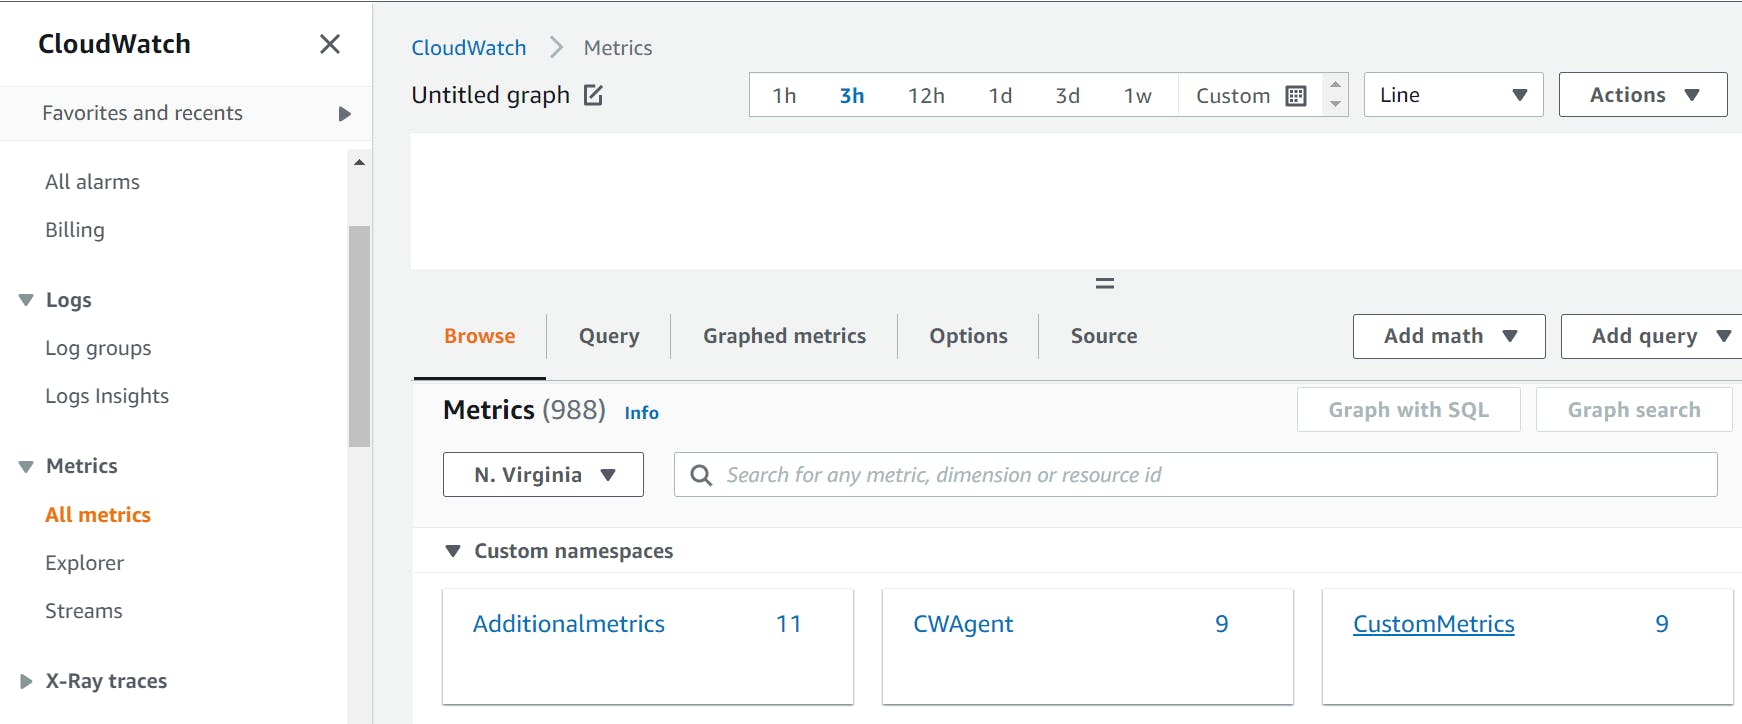
'CustomMetrics' is the name we have given in the config.json file.
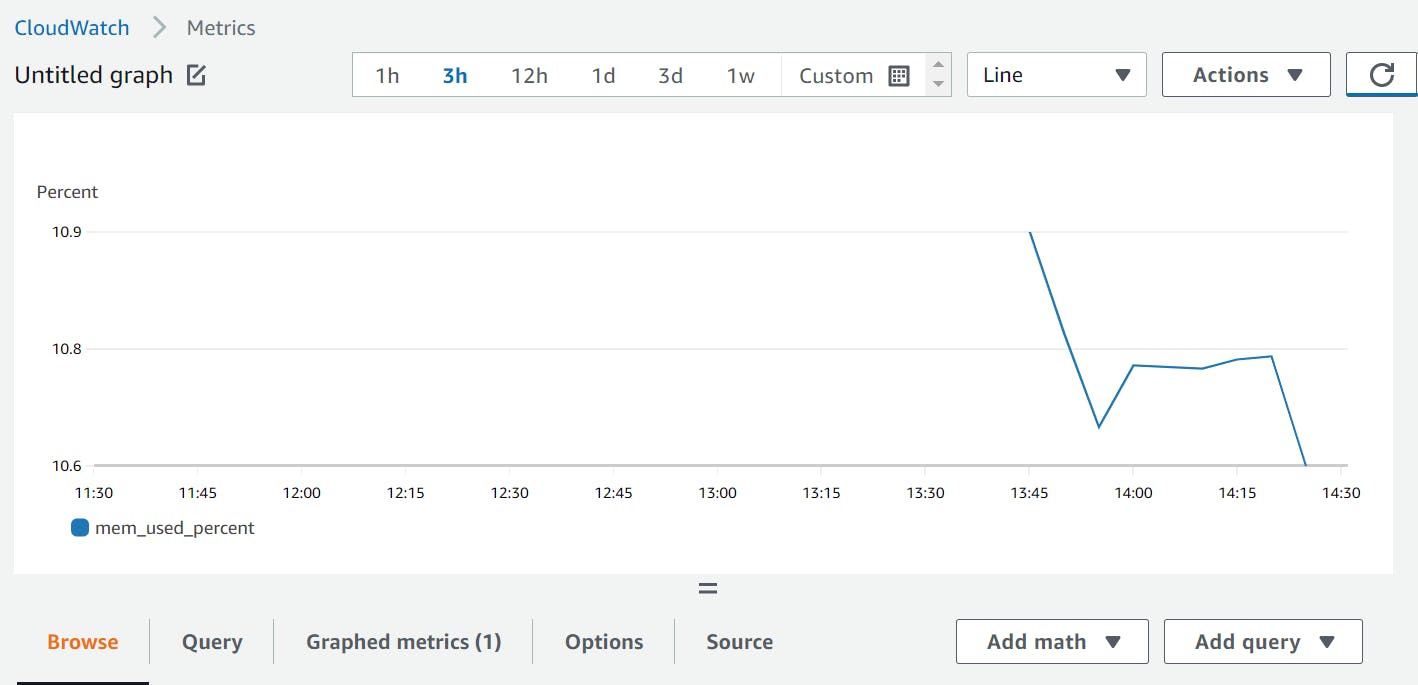
Select CustomMetric and go to the third block and you shall see your instance with two metric name filters
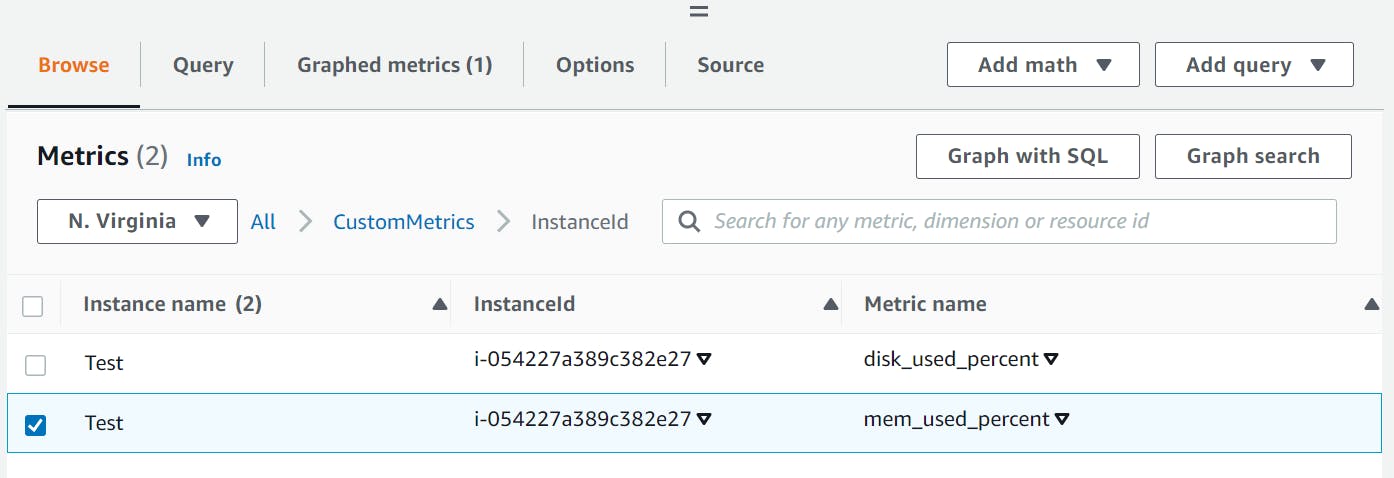
Select the instance name of the 'mem_used_percent' metric and scroll up. The graph of your EC2 Instance's memory usage will reflect here.
Step 4
Now, CloudWatch can monitor the memory usage of the EC2 instance, So If you wish to set an alarm when your EC2 instance has used more than 80% or 90% of data you can easily set it using a custom metric.
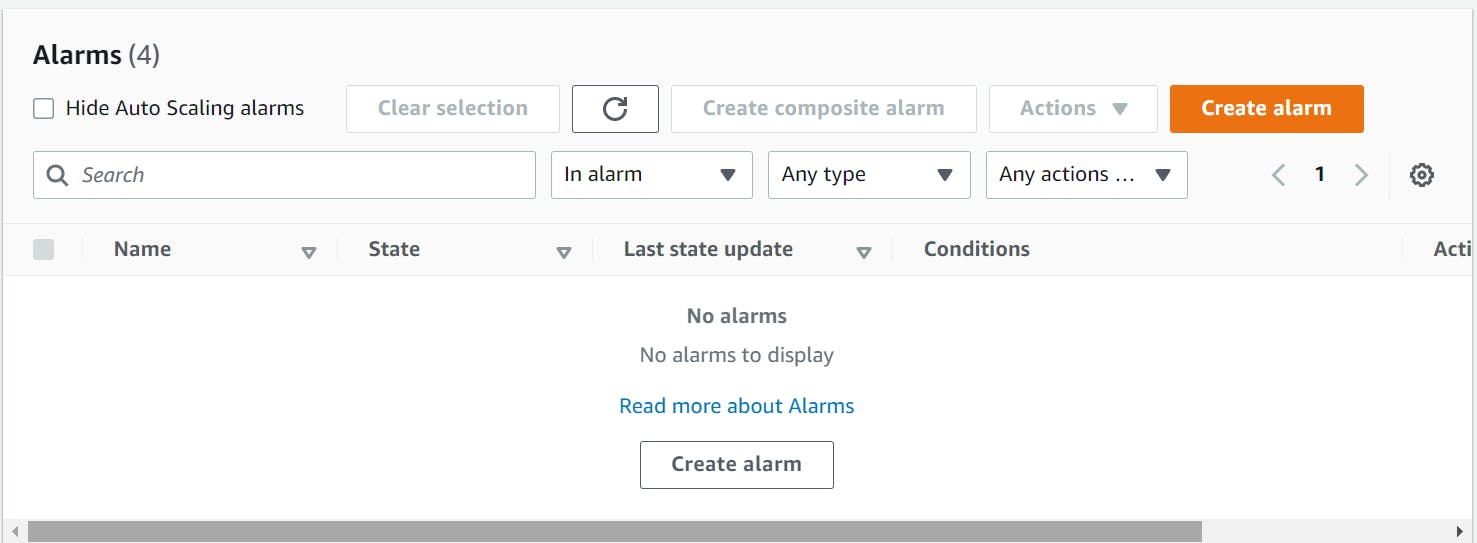
For this navigate to the left panel of the CloudWatch Dashboard → Go to All Alarms → Create Alarm
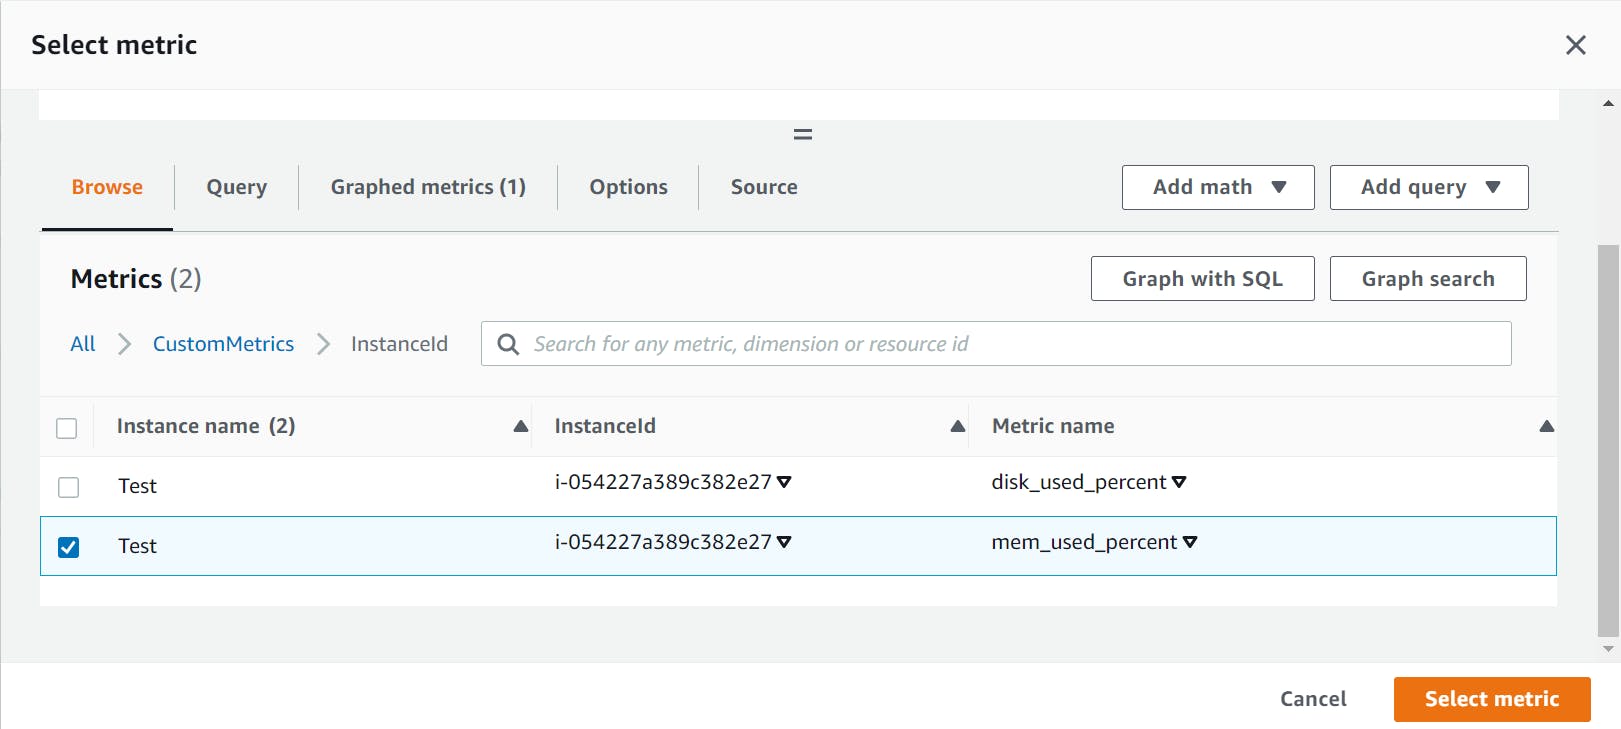
Click on Select metrics It will take you to a metric page of CloudWatch Dashboard → Select metric.
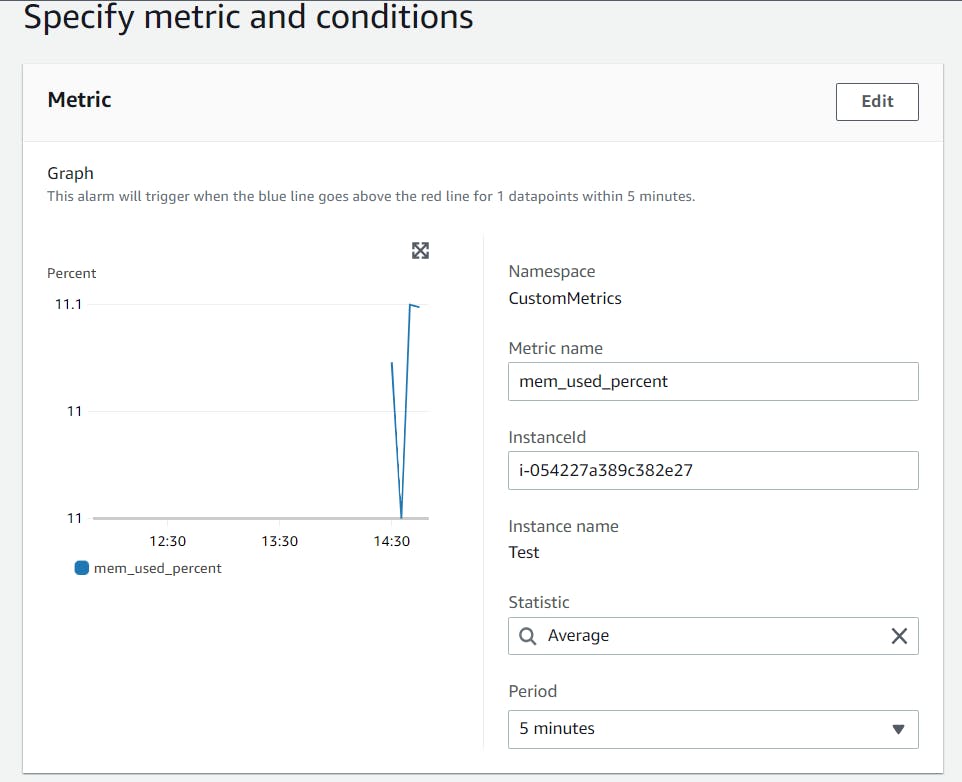
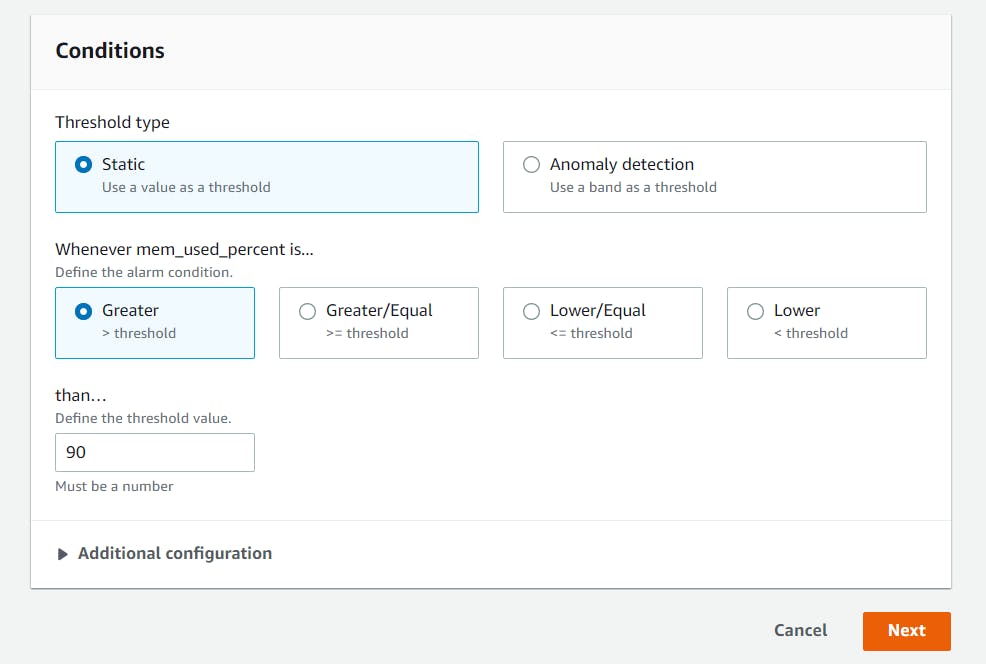
Once you select the metric you need to configure your alarm in four steps. First, specify the metric and condition. In conditions, select values based on your requirement as below, I am selecting Threshold as 90%, so whenever my Ec2 memory utilization reaches 90%, I will be getting an Alarm and then click on Next.
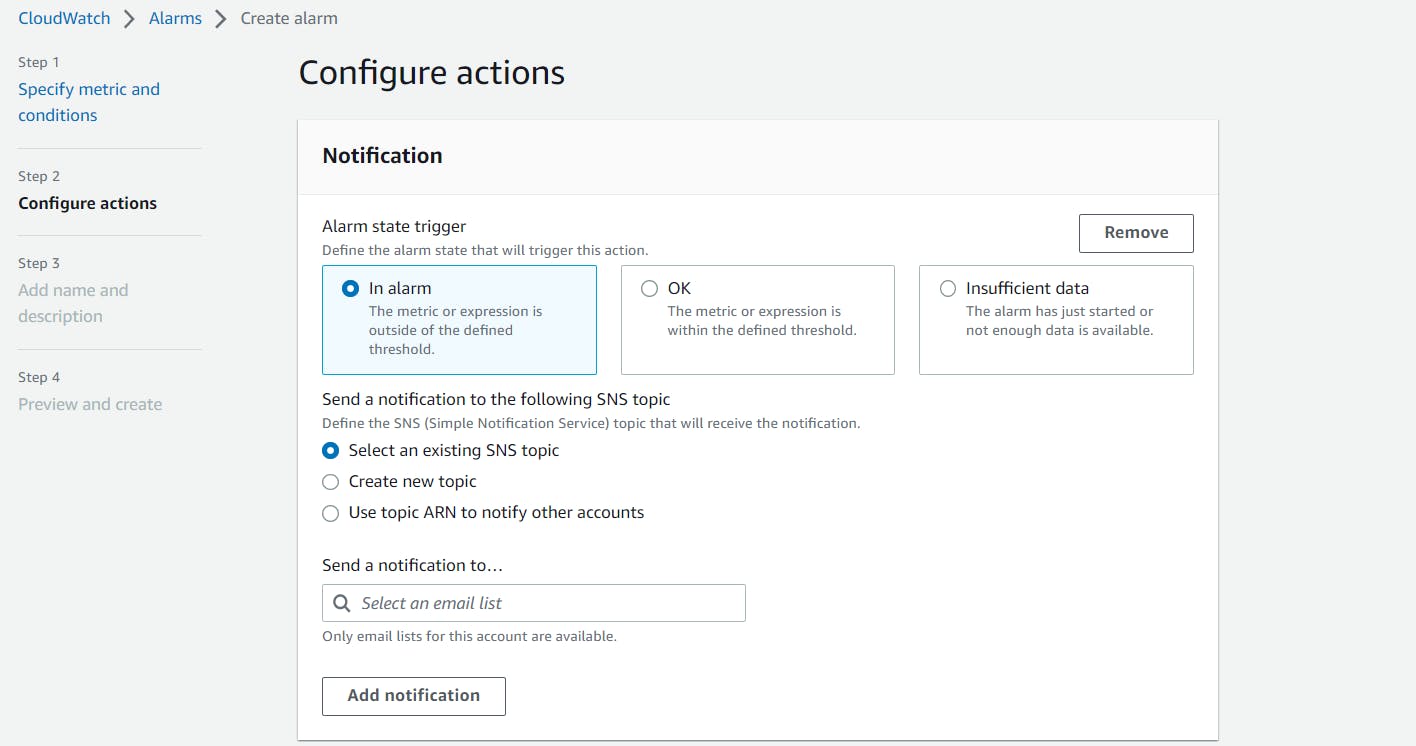
Next step is to select the notification configuration, Here I am using the Existing SNS topic.
🖊️ I will not go deep into creating an SNS topic and Subscription, If you don't know about SNS then you can refer to this link https://docs.aws.amazon.com/sns/latest/dg/sns-create-topic.html also go through https://docs.aws.amazon.com/sns/latest/dg/sns-create-subscribe-endpoint-to-topic.html
Now if you have SNS already created then select the SNS topics which you created earlier and click on Next → and set the Alarm name → preview and create
After creating an alarm, It will be in Insufficient Data for some time and then will be moved to the Ok state. Now Whenever your Ec2 instance memory utilization reaches 90%, you will get an Email saying that Memory utilization reaches 90% (You can also use teams, slack to get notifications instead of email)
Easy right? I hope you found it useful if you were looking into other than default monitoring options. Any suggestions would be highly appreciated.
Happy Learning!😉